Table 1. Diets composition and food (g) and caloric (Kcal) intakes per 24 h, represented as means ± SEMs from a total of n=6 animals per group; *= P<0.05 vs STD
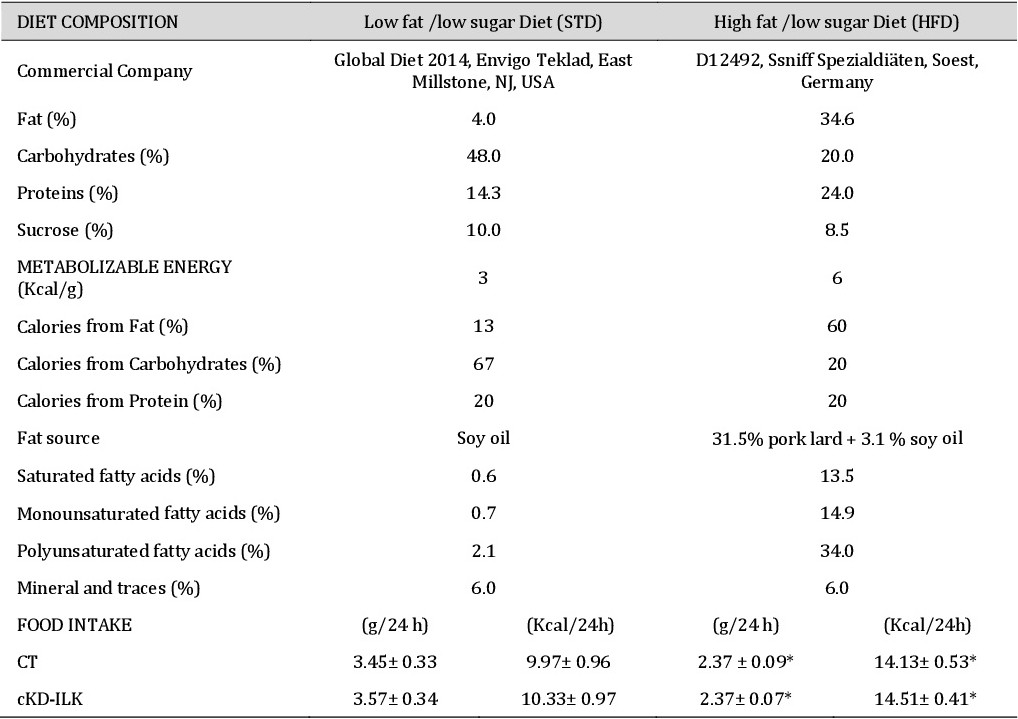
Table 1. Diets composition and food (g) and caloric (Kcal) intakes per 24 h, represented as means ± SEMs from a total of n=6 animals per group; *= P<0.05 vs STD